Interpreting Continuous Glucose Monitoring (CGM) Data
Introduction
Continuous Glucose Monitoring (CGM) has increased in popularity as a tool for blood glucose management for people with diabetes. With improvements in sensor accuracy, simplicity, the ability to download data and the expansion of Australian Government subsidies, people living with diabetes can use CGM to achieve better clinical outcomes. The qualification of data and the generation of applicable reports can help people improve their day to day lives. The key to a person gaining better clinical outcomes is the appropriate analysis and interpretation of data by the diabetes Health Care Provider (HCP)1.
Moving away from 4-6 fingerstick blood glucose values a day, capturing only points in time, to capturing upwards of 288 glucose values a day, the retrospective pattern analysis of CGM data is one of the best ways to help someone with diabetes to benefit from CGM use. This requires the HCP to have access to1:
- Standardised CGM metrics
- Graphical visualisation of the glucose data and daily CGM profile
- Clear clinical targets
Standardised CGM Metrics
In February 2017, the Advanced Technologies and Treatment for Diabetes (ATTD) Congress convened an international panel of expert diabetes clinicians, researchers and individuals from all over the world to define core metrics for assessing CGM data1. The list of CGM metrics has now been streamlined for use in clinical practice. The expert panel selected ten metrics that may be most useful in clinical practice (see Table 1). Fundamental to accurate and meaningful interpretation of CGM is ensuring that adequate glucose data is available for evaluation. Having the CGM attached for at least 70% of the time over the most recent 14 days provides data which correlates strongly with three months of mean glucose, time in ranges and hyperglycaemia metrics. Of note, longer CGM data collection points may be required for individuals with greater glycaemic variability, particularly to assess hypoglycaemia exposure1.
Table 1: Standardised CGM metrics for clinical care
| 1. Number of days CGM worn (recommended 14 days) |
| 2. Percentage of time CGM is active (recommended 70% of data from 14 days) |
| 3. Mean glucose |
| 4. Glucose management indicator (GMI) |
| 5. Glycaemic variability (%CV) target ≤ 36%* |
| 6. Time above range (TAR): % of readings and time > 13.9mmol/L |
| 7. Time above range (TAR): % of readings and time between 10.1-13.9mmol/L |
| 8. Time in range (TIR): % of readings and time between 3.9-10.0mmol/L |
| 9. Time below range (TBR): % of readings and time between 3.0-3.8mmol/L |
| 10. Time below range (TBR): % of readings and time < 3.0mmol/L |
CV, coefficient of variation
* Some studies suggest that lower %CV targets (<33%) provided additional protection against hypoglycaemia for those receiving insulin or sulfonylureas
Adapted from: Diabetes Care 2019:42:1593-1603
Time in Ranges
Time spent within blood glucose ranges as a metric of glycaemic management provides more actionable information than HbA1c alone. The expert panel agreed that establishing target percentages of time in the various glycaemic ranges with the ability to adjust the percentage cut points to address the specific needs of people living with diabetes, would allow for effective therapeutic decision-making.
The time in ranges metric includes five key CGM measurements:
- Percentage of readings and time per day spent within the target glucose range- Time in range (TIR) (3.9- 10.0 mmol/L)
- Time below target glucose range (TBR) level 1 (3.0-3.8mmol/L)
- Time below target range (TBR) level 2 (<3.0 mmol/L)
- Time above range (TAR) level1 (10.1-13.9mmol/L)
- Time above range (TAR) level 2 (>13.9 mmol/L)
CGM metrics and individualising care
The time in range metrics can be applied to different diabetes populations including those who are older/higher risk, pregnant women with pre-gestational diabetes and women with gestational diabetes (GDM) (Figure 1).
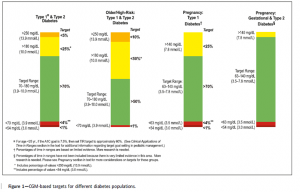
(Diabetes Care 2019; 42:1593-1603)
Older and/or high- risk refers to people who are at notably at higher risk for severe hypoglycaemia due to their age, duration of diabetes, duration of insulin therapy and/or presence of hypoglycaemia unawareness1. For older people living with diabetes we also need to consider cognitive and physical impairments, living alone and other comorbidities. In high risk individuals, a conservative approach is recommended, with a strong focus on reducing the percentage of TBR and preventing excessive hyperglycaemia1.
During pregnancy, the goal is to safely increase TIR as quickly as possible, while reducing TAR and glycaemic variability1. Research has found that increasing TIR during the second and third trimesters
is associated with decreased risk of LGA and neonatal outcomes including macrosomia, shoulder dystocia, neonatal hypoglycaemia, and neonatal intensive care admissions1. More research is needed to define clinical CGM targets for women with GDM or type 2 diabetes in pregnancy, but there is some evidence that more stringent targets are needed to optimise outcomes1.
Standardisation of CGM data presentation
There is a general consensus that a useful CGM report is one that can be understood by HCP and people with diabetes. A single page report that the clinical team can review and file in the medical record and can be used as a shared decision-making tool with people with diabetes was considered to be of value1. A CGM report that allows the HCP to openly discuss in the presence of the person, reflecting on real time data is of most value. Allowing the person with diabetes, and/or their family or carer, to view their CGM report can help to enhance their understanding of diabetes, through identifying areas of concern. This, in turn, supports the provision of more personalised therapy through shared decision-making and goal setting.
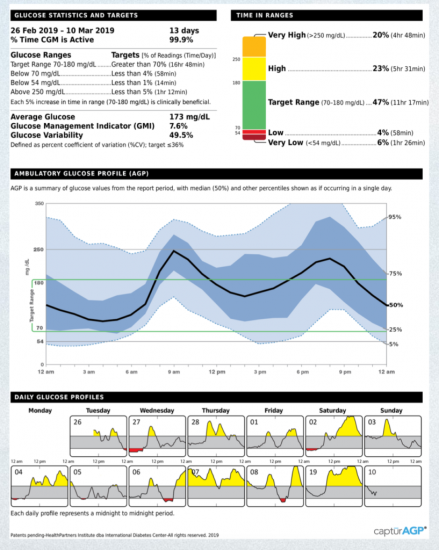
If software could be standardised in line with the recommendations of the consensus committee, again it would be much easier to ensure collaboration of care. A one-page Ambulatory Glucose Profile (AGP) Report such as the example in Figure 2, meets the recommendations of the international panel of HCPs, researchers and individuals with diabetes1. It is colourful and visual and provides a concise summary that is engaging and easy for the HCP to discuss with the person with diabetes and/or their family/carers.
(Diabetes Care 2019; 42:1593-1603)
Using the AGP report in clinical practice
Several factors can be considered when reviewing the AGP with an individual with diabetes:
- Are glucose levels within target on waking? If not, consider adjusting basal insulin.
- Do levels spike above 10.0mmol/L two hours after meals? If so, consider whether are they taking insulin before or after eating or whether mealtime insulin doses need adjusting.
- Evaluate the day to day variability – if variability is high then is the cause of the variability understood?
- Does the percentage of hypoglycaemia exceed the recommendation? In my opinion this is the most important range to review because the practical implications for a person driving, working, and living with diabetes who has reduced hypoglycaemic awareness can be extremely dangerous.
As time is of the essence in most public and private practices it is important to find a concise way of obtaining and analysing the data to look at the most important issues. The ideal AGP report shows Time in Ranges, Glucose Statistics and Targets, at least 14 days of data to analyse as well as Daily Glucose Profiles. The HCP can use the glucose metrics above to analyse the data efficiently.
After reviewing the data, the following could be considered:
- The first question to ask a person with diabetes in a consultation should be “Is there anything concerning you about your diabetes?”
- Discuss the CGM report with the person with diabetes, along with recommended CGM-based targets and determine their personal goals.
- Help the person with diabetes and/or their family/carer to understand the limitations of the HbA1c compared to the estimated HbA1c or glucose management indicator seen on the CGM reports which allow for direct observation of glycaemic excursions and immediate feedback.
- Do glycaemic targets require revision?
- Develop a plan to increase TIR.
- Do glucose lowering medicines need adjustment as a result of the data? If the person with diabetes is self-adjusting glucose lowering medications (GLMs), is that being done in a way that indicates they understand the data, or are interventions such as insulin stacking occurring?
- Check the postprandial excursions and consider the need to strengthen insulin to carbohydrate ratios or refer onto an Accredited Practising Dietitian experienced in diabetes management2.
- Establish a therapeutic action plan via summary of the consultation’s main points and why changes need to take place.
Copy the clinical report letter to the person with diabetes as well as the GP so goals are summarised and clear in writing.
Conclusion
The access to CGM technology for people living with diabetes is an exciting space to be involved in and analysing CGM data is becoming a much bigger part of our work in clinical practice. Living through this particularly challenging time with the CoVID–19 pandemic, where we are trying to limit face to face consultations and instead move to teleconferencing, we rely more than ever on the ability of the person to upload their own data at home allowing us to connect remotely at the time of consultation. In our role as diabetes HCPs we can offer practical solutions on reflection of a person’s CGM data making use of the metrics above. This has the potential to change the way people engage with their diabetes on a daily basis. The time in range values (time in target, time below target, and time above target) and the standardised AGP are practical and useful because they identify problem areas and can be used to start conversations that lead to more meaningful discussions enabling people to optimise their diabetes management.
References
1.Battelino T, Danne T, Bergenstal RM, et al. Clinical targets for continuous glucose monitoring data interpretation: recommendations from the international consensus on time in range. Diabetes Care. 2019; 42(8): 1593-1603
2.Scheiner G. CGM retrospective data analysis. Diabetes Technol Ther. 2016; 18 Suppl 2 (Suppl 2): S214-S222